pBRIT candiate gene prioritization
Welcome to the pBRIT gene prioritization portal
pBRIT stands for priortization of candidate genes using Bayesian Ridge Regression and Information Theoretic Model. It is an adaptive and scalable prioritzation tool that integrates Pubmed Abstracts, Gene Ontology, Pathways (Biocarta, EHMN, HumanCyc, INOH, KEGG, NetPath, PharmGKB, PID, Reactome, Signalink, SMPDB, WikiPathways), Protein-Protein Interactions (PhosphoPOINT, PDZBase, NetPath, PINdb, BIND, CORUM, Biogrid, InnateDB, MIPS-MPPI, Spike, Manual upload, MatrixDB, DIP, IntAct, MINT, PDB, HPRD), Protein sequence similarities (BLAST), Mouse Phenotype Ontologies (MPO), Human Phenotype Ontology (HPO), Disease Ontology (DO), Genetic association database (GAD), HuGe. pBRIT is available as web-interface for single exome prioritization or as an API for >1000 exomes in batch mode.
Usage instructions and example data are available in the documentation. (or here)
Citing
When you use pBRIT in your research, please cite the following paper:
Ajay Anand Kumar, Lut Van Laer, Maaike Alaerts, Amin Ardeshirdavani, Yves Moreau, Kris Laukens, Bart Loeys, Geert Vandeweyer; pBRIT: Gene Prioritization by Correlating Functional and Phenotypic Annotations Through Integrative Data Fusion, Bioinformatics, , bty079, https://doi.org/10.1093/bioinformatics/bty079
NEWS:
- 2018-02-14: Our manuscript has been accepted by Bioinformatics. It's available -->here <--.
- 2017-09-20: Uploaded a new Example data set for API usage: Here.
- 2017-02-12: Moved adapted processing from beta to main.
- 2016-10-29: BETA function activated : processing time of large test sets (> 1000 genes) was reduced from days to approximately 30 minutes.
- 2016-10-29: Bug fixed in queue processing. A number of jobs did not get submitted over the last few weeks. We fixed it and submitted the jobs now.
pBRIT Principles:
The main principle behind pBRIT is that genes that share similar functional relationship might also share similar phenotypic relationship. pBRIT has three stages:
- Unsupervised approach for feature mining and assigning statistical weights using TF-IDF and computing gene-by-gene similarity profiles using TF-IDF and TF-IDF → SVD
- Early integration for genomic data fusion
- Supervised approach i.e Bayesian ridge regression which is a discriminatory model to prioritize candidate genes.
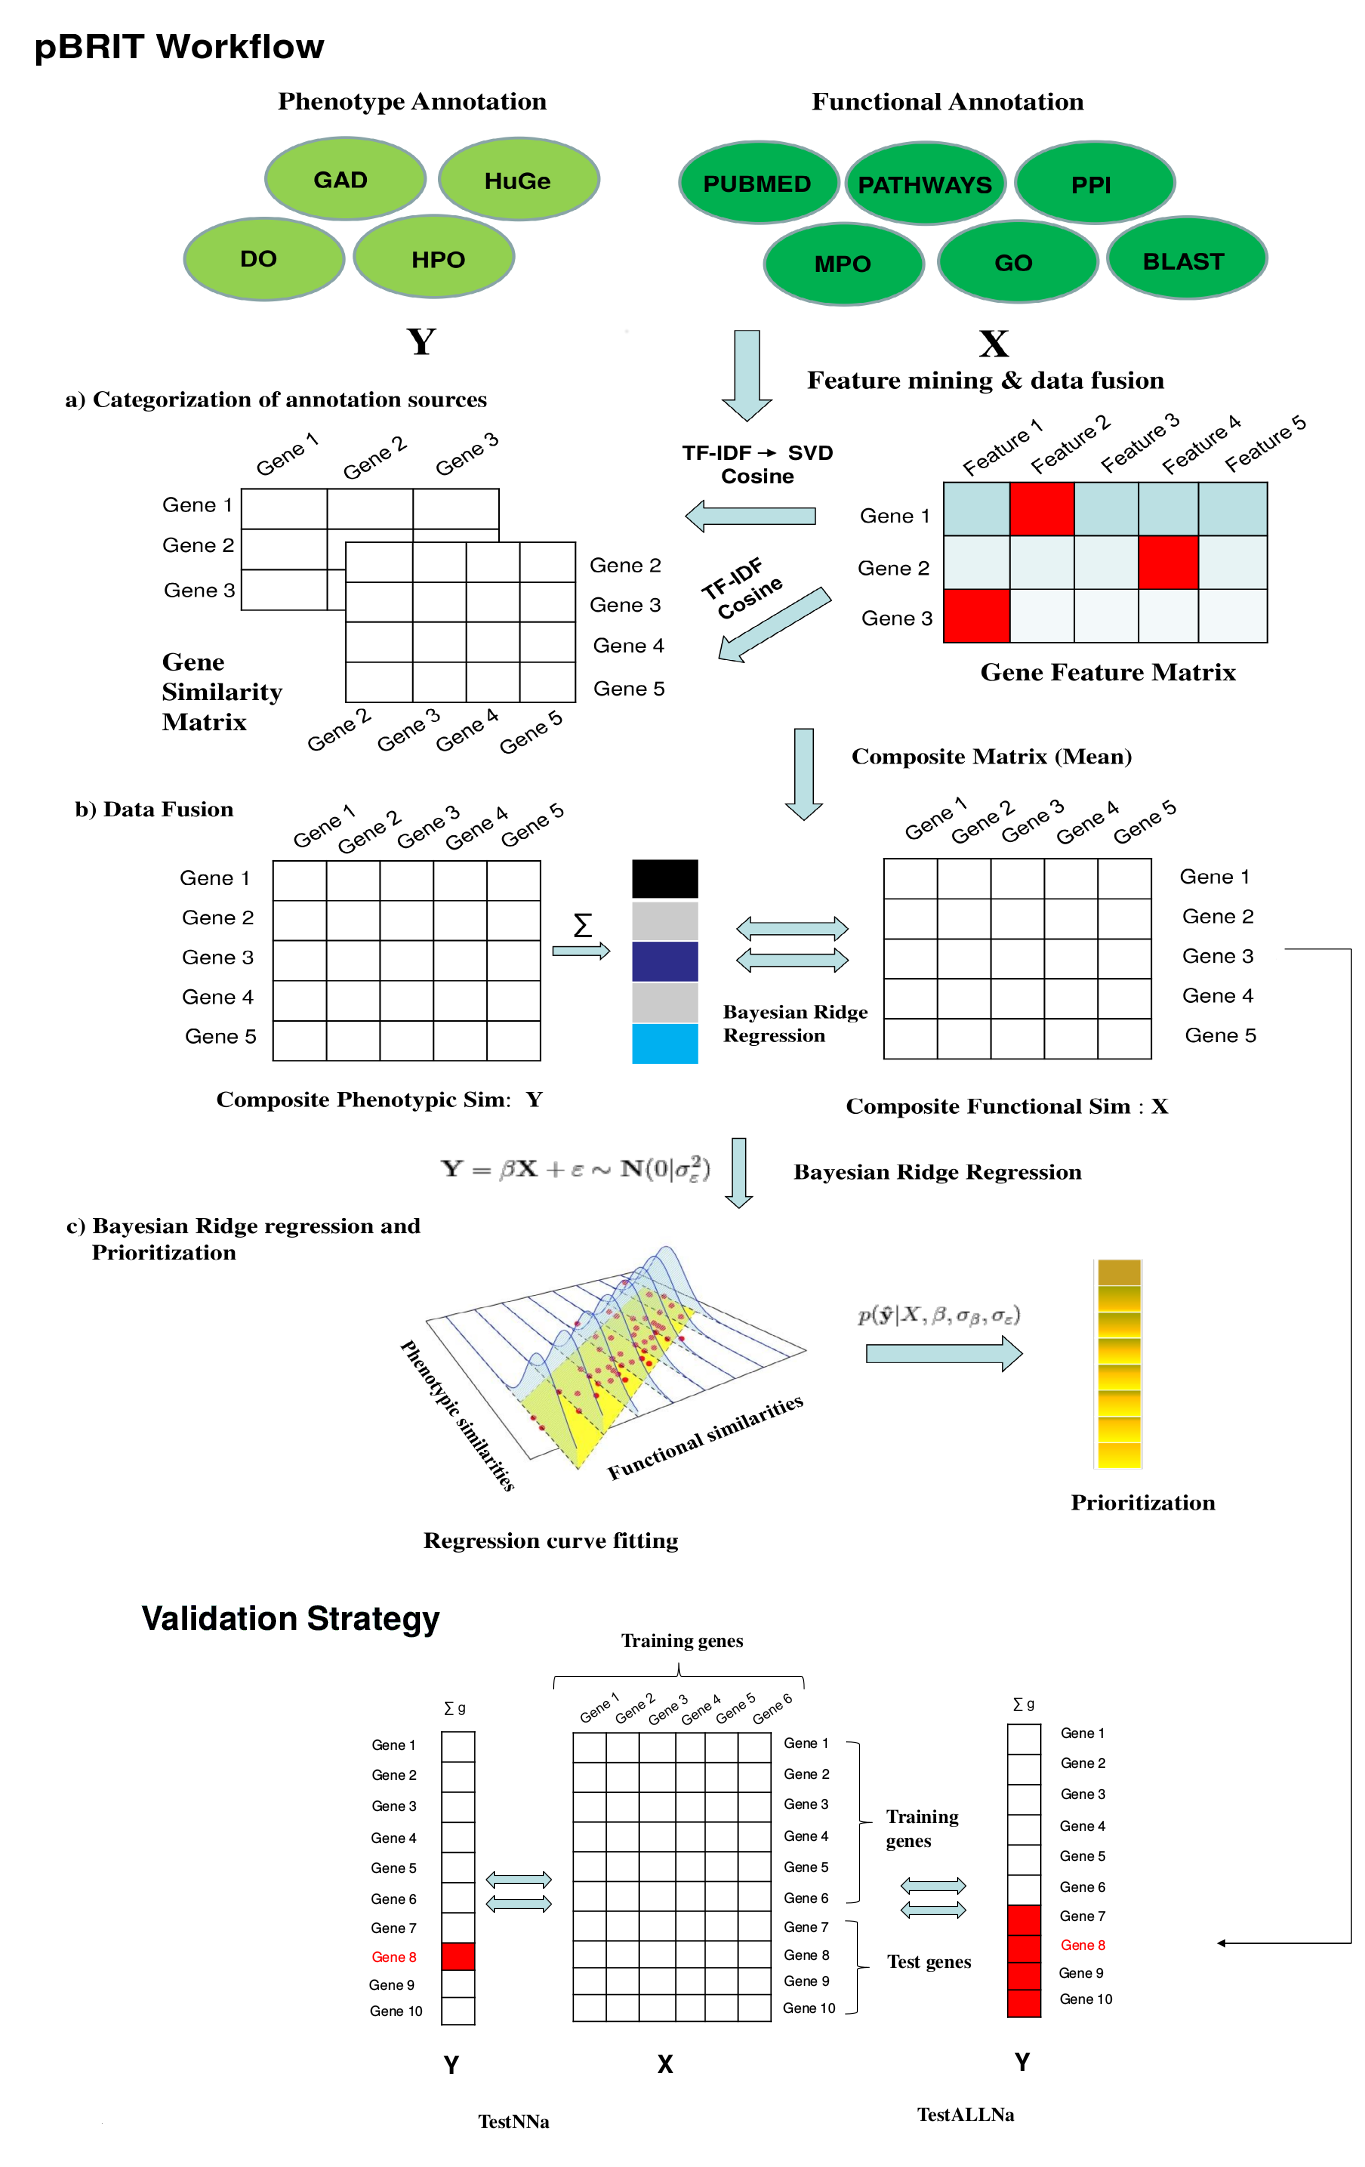
pBRIT Workflow
Stage 1: The annotation sources are categorized under functional and phenotypic annotation sources. All the annotation matrices are represented as sparse binary matrices for fast and effective feature mining in runtime memory. An unsupervised approach towards feature mining is applied by assigning statistical weights to features using TF-IDF calculations.
For modelling co-occurrences and latent semantic dependencies between the features and its effect in overall prioritization we applied Singular Value Decomposition (SVD) on TF-IDF computed annotation matrices. This is denoted as TF-IDF→SVD or TF-IDF transformed using SVD.
Stage 2: We obtain gene-by-gene proximity profiles for each of these annotation sources and create a composite matrix by taking inter-matrix means over all functional or phenotypic annotation category. The composite matrices are the final similarity matrices incorporated into the regression model in the next stage.
Stage 3: For a given set of training genes, the gene-by-gene similarity matrix are retrieved under the following regression design settings:
YPheno = β XFunc + ε~N(0,σε2)
We incorporate ridge regression under a Bayesian framework to model the phenotype concordance scores, based on the functional annotations, for the given training genes.
p(ŷ|X,β,σβ,σε) denotes the expected phenotypic concordance scores with respect to available functional information. The input test genes are then prioritized by sorting this predicted phenotypic concordance score.
Regression Details: The performance of pBRIT depends upon two aspects:
- Feature mining: Incorporation of TF-IDF or TF-IDF→SVD based feature mining.
- Regression design: Effect of incorporating phenotype information of the test genes into the regression model (TestNNa vs TestALLNa)